Spectral Tuning Mechanism (STM) System
Make your solar simulator spectrally-tunable: STM System for solar simulators
Our products offer a unique optional system called the Spectral Tuning Mechanism (STM) that allows users to customize the spectral irradiance (distribution) of solar simulator. User can select any wavelength range, from ultraviolet to infrared, and modify it with a simple way. This STM system gives more flexibility and control over solar simulation applications. It is especially useful for measuring Multi-junction (III–V, Perovskite-on-silicon, etc) solar cells, as it effectively reduces measurement uncertainty and leads to more accurate measurement results.
Why STM necessary?
The most important thing in solar cell measurement (I-V measurement with solar simulator) is the determination of effective irradiance. This means the measurement of the test solar cell under the solar simulator's irradiance is the same as if it would be under AM1.5G irradiance. In terms of quantity, the measured Isc (short-circuit current) of solar cell under the solar simulator should be equal to what it would be under AM1.5G irradiance.
To measure Isc correctly, we need to compare the spectral irradiance distribution of solar simulator with the reference spectral irradiance Eλref(λ) distribution. If they are different, we have to use a spectral mismatch correction factor ( SMM→Learn more about spectral mismatch factor) to adjust the Isc value or change the total irradiance of the solar simulator to achieve this correction (make SMM=1).
In the context of Multi-junction (Perovskite tandem)→Learn more about Multi-junction solar cells, using individual reference cells that match the spectral response of each junction is preferred for accurate current matching, which can reduce measurement uncertainty. However, due to the varied quantum efficiency (QE) across different junctions, it's uncommon for labs to have perfectly matched reference cells available. Traditional methods for spectral mismatch correction are labor-intensive, involving multiple adjustments and measurements. To streamline this process, one approach involves using a multi-source simulator with an automated algorithm that adjusts spectral irradiance to ensure current matching across all junctions. Another quicker method employs a multi- source simulator with separate light sources for each junction, using linear equations to set appropriate irradiance levels, thus simplifying the adjustment process.[2]
For instance, our RHS series boasts a superior spectral match compared to single light source xenon solar simulators. By modulating the output of the xenon lamp within the 300- 750nm range and the halogen lamp in the 750-1800nm range, it is possible to fine-tune the spectral distribution balance to a certain degree (refer to the Figure 1 below). Nevertheless, for precise measurement of multi-junction solar cells, such as the three-junction type, it may be necessary to make adjustments across several spectral distribution regions within the 300-1200nm or 300-1800nm ranges. Solely using xenon and halogen lamps for these adjustments may prove to be inadequate.
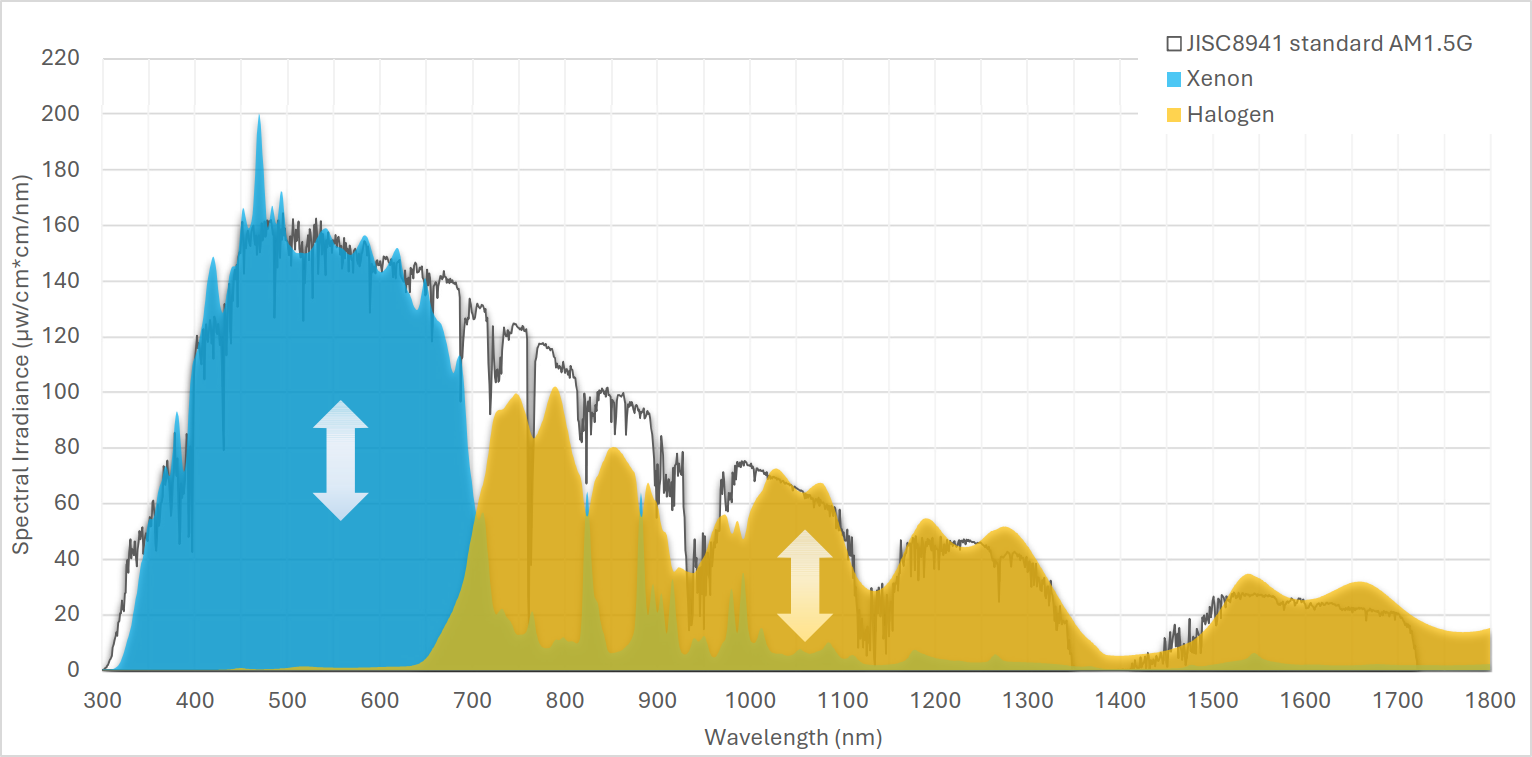
Figure1: Spectral Irradiance Adjustment of RHS Series
How STM works?
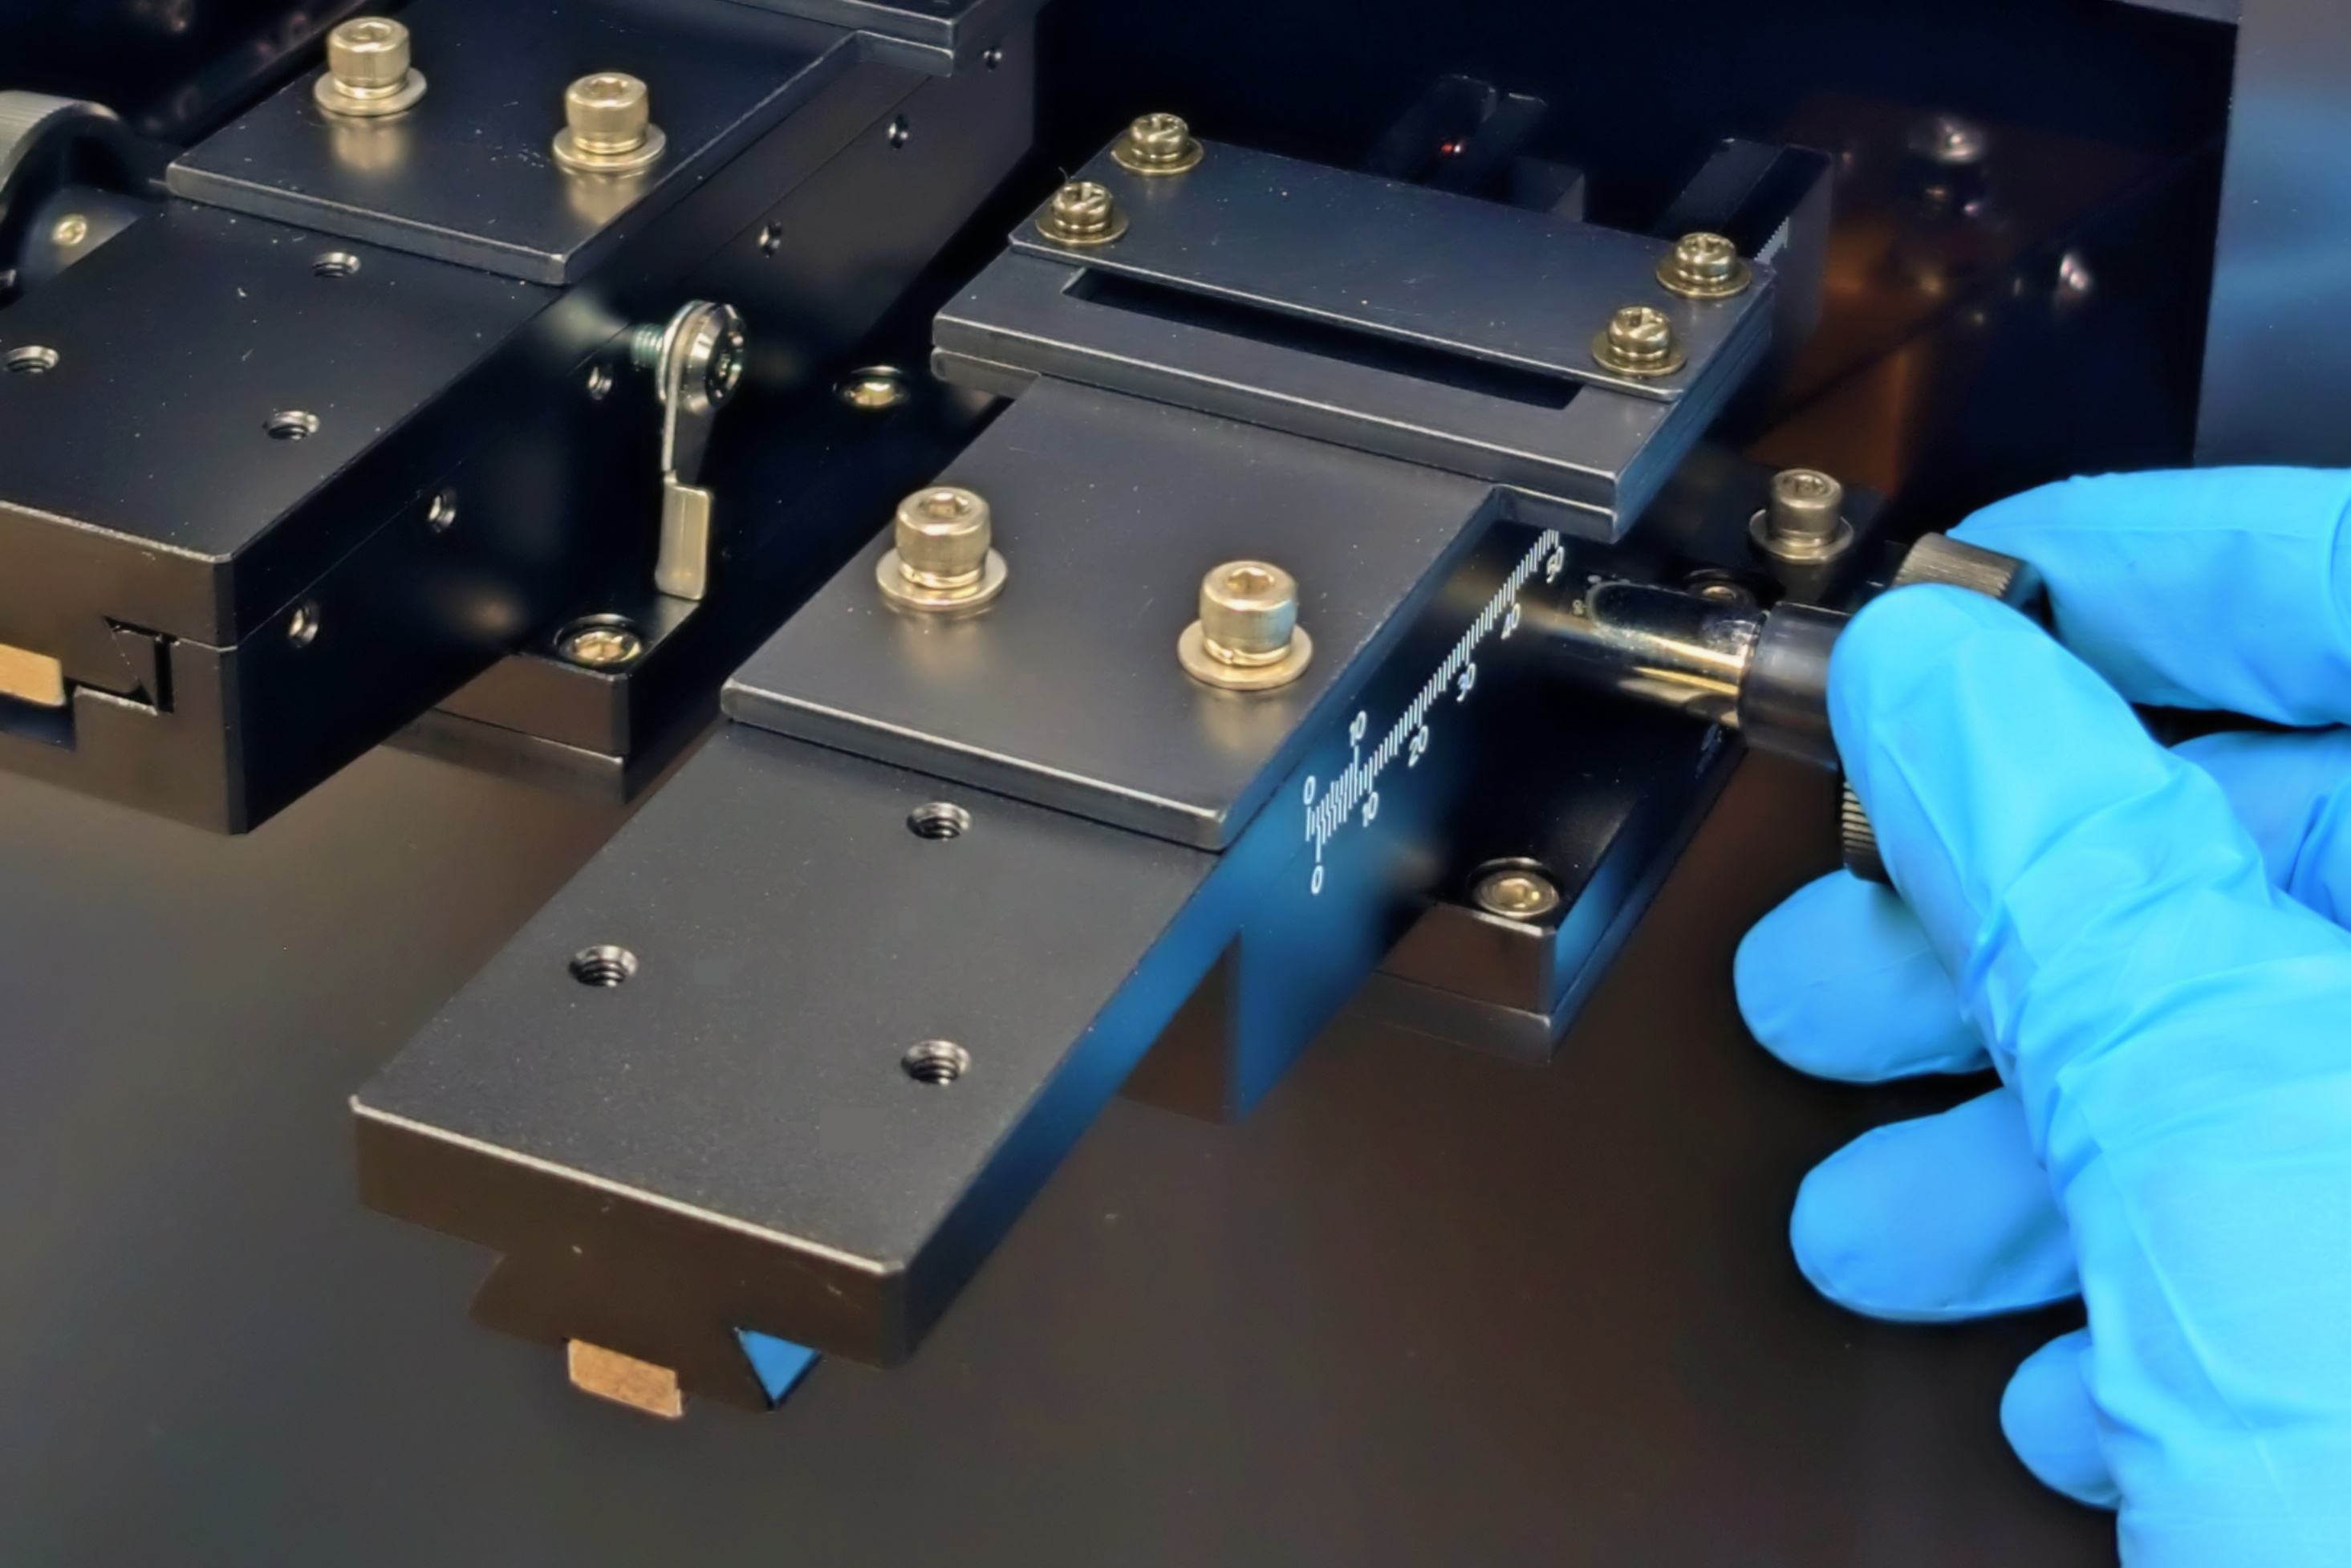
The STM system is equipped with an optical filter insertion mechanism aligned with the light axis of the solar simulator. For our dual lamp type solar simulators (RHS series), there are typically two channels for each, totaling four channels, allowing insertion in both the ultraviolet to visible spectrum (xenon lamp side) and the infrared spectrum (halogen lamp side). This setup enables spectral irradiance adjustments across at least four wavelength domains.
With the RHS series, the output control of xenon and halogen lamps already allows for balancing the wavelength distribution around the 750-800nm threshold. The addition of the above-mentioned STM system further enhances the capability for fine-tuning wavelength distribution across a broader range.
Spectral Variance in Solar Simulators: The Impact of STM System
Figure 2 depicts the changes in spectral distribution when the STM system is employed compared to its absence. The light blue line indicates the spectral irradiance distribution of the RHS series solar simulator without the STM system. Due to spectral mismatching, in the absence of STM (as shown on the left side of Table 1), the distribution in the 350-450 nm range is higher than the reference spectrum, with a peak mismatch of +14.7%. Conversely, the distribution is lower than the reference spectrum in the 700-750 nm and 800-850 nm ranges. Furthermore, the infrared range distribution is also higher than the reference spectrum, with a maximum mismatch of +12.6%. These mismatches exceed the ±5% mismatch standard of the MS class defined by JIS C 8904-9, but they still fall within the MA class's permissible range of ±25%. The integration of the STM system, along with the addition of two types of adjustment filters, is represented by the orange line in Figure 2. This illustration confirms that the spectral irradiance distribution with the STM system more closely approximates the AM1.5G reference spectrum. Additionally, the spectral mismatch clears the MS class (within ±5%), as detailed on the right side of Table 1. As shown in Table 2, the SPD values also show improvement with the use of STM. Without STM, the SPD of the RHS was 11.5% (SPD of most solar simulators have a range of 15%-50%, and within 15% is considered quite excellent), and with STM, it improved to 10.3%.

Figure2: Spectral Irradiance Adjustment: Effect of the STM system
Due to spectral mismatching, in the absence of STM (as shown on the left side of Table 1, the distribution in the 350-450 nm range is higher than the reference spectrum, with a peak mismatch of +14.7%. Conversely, the distribution is lower than the reference spectrum in the 700-750 nm and 800-850 nm ranges. Furthermore, the infrared range distribution is also higher than the reference spectrum, with a maximum mismatch of +12.6%. These mismatches exceed the ±5% mismatch standard of the MS class defined by JIS C 8904-9, but they still fall within the MA class's permissible range of ±25%.
Table1: Spectral match's comparison: Effect of the STM system
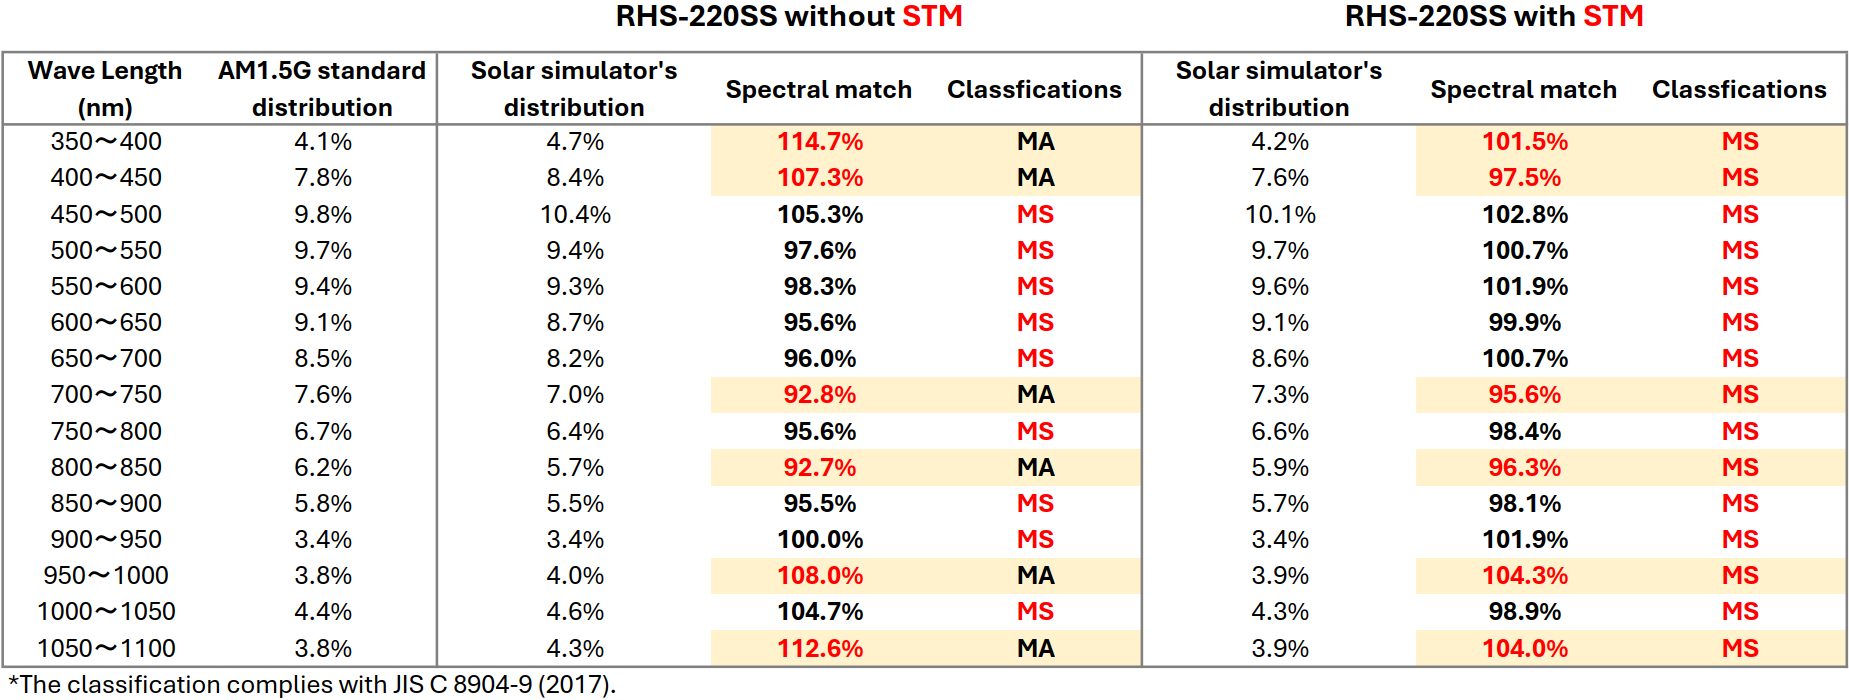
The integration of the STM system, along with the addition of two types of adjustment filters, is represented by the orange line in Figure 2. This illustration confirms that the spectral irradiance distribution with the STM system more closely approximates the AM1.5G reference spectrum. Additionally, the spectral mismatch clears the MS class (within ±5%), as detailed on the right side of Table 1.
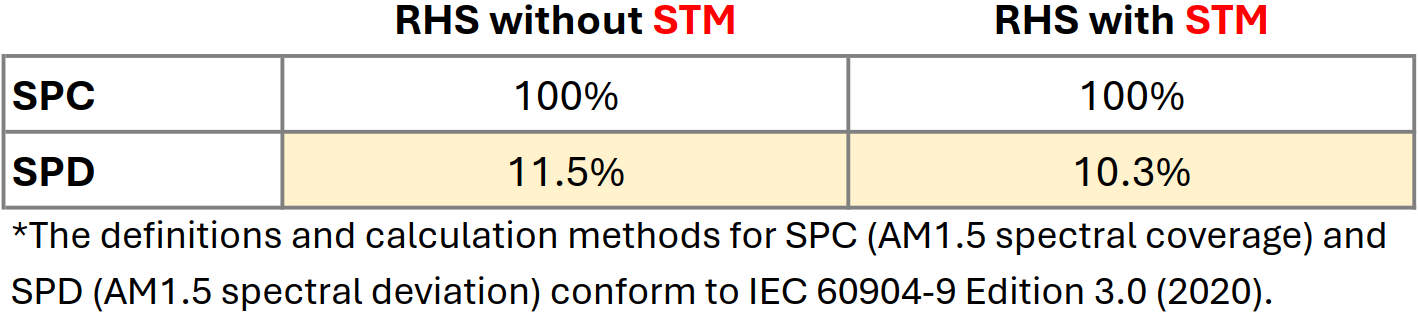
As shown in Table 2, the SPD values also show improvement with the use of STM. Without STM, the SPD of the RHS was 11.5% (SPD of most solar simulators have a range of 15%- 50%, and within 15% is considered quite excellent), and with STM, it improved to 10.3%.
Table 2: Comparing SPC & SPD of RHS Series with/without STM
Features of STM System
1. Spectral Adjustability
The STM system provides the flexibility to adjust spectral irradiance of solar simulator within the 300-1800nm range, utilizing the necessary filters for precise modification.
2. Enhanced Spectral Matching
Utilizing the STM system improves spectral matching accuracy without negatively impacting the uniformity of irradiance or causing temporal instability.
The RHS series has achieved a high level of spectral matching. With the integration of the STM system, it is possible to attain a spectral distribution that closely mirrors the reference spectrum throughout the 300-1800 nm range. The STM's distinctive insertion structure also ensures that irradiance uniformity is maintained. Combining the STM with the RHS series solar simulator greatly enhances the measurement accuracy of multi-junction (Perovskite Tandem) solar cells. Moreover, the STM can be incorporated into a single Xenon solar simulator, resulting in a more streamlined and efficient setup.
References
- IEC 60904-7:2019, Photovoltaic devices - Part 7: Computation of the spectral mismatch correction for measurements of photovoltaic devices.
- T. Song, C. Mack, R. Williams, D. J. Friedman, N. Kopidakis, How Should Researchers Measure Perovskite-Based Monolithic Multijunction Solar Cells' Performance? A Calibration Lab's Perspective, Sol. RRL 2022, 2200800.